Rank Report
Turn grid scans into a report clients understand
Every scan builds an interactive map: rank colors on each pin, summary metrics, and drill-down SERP lists for any grid point.
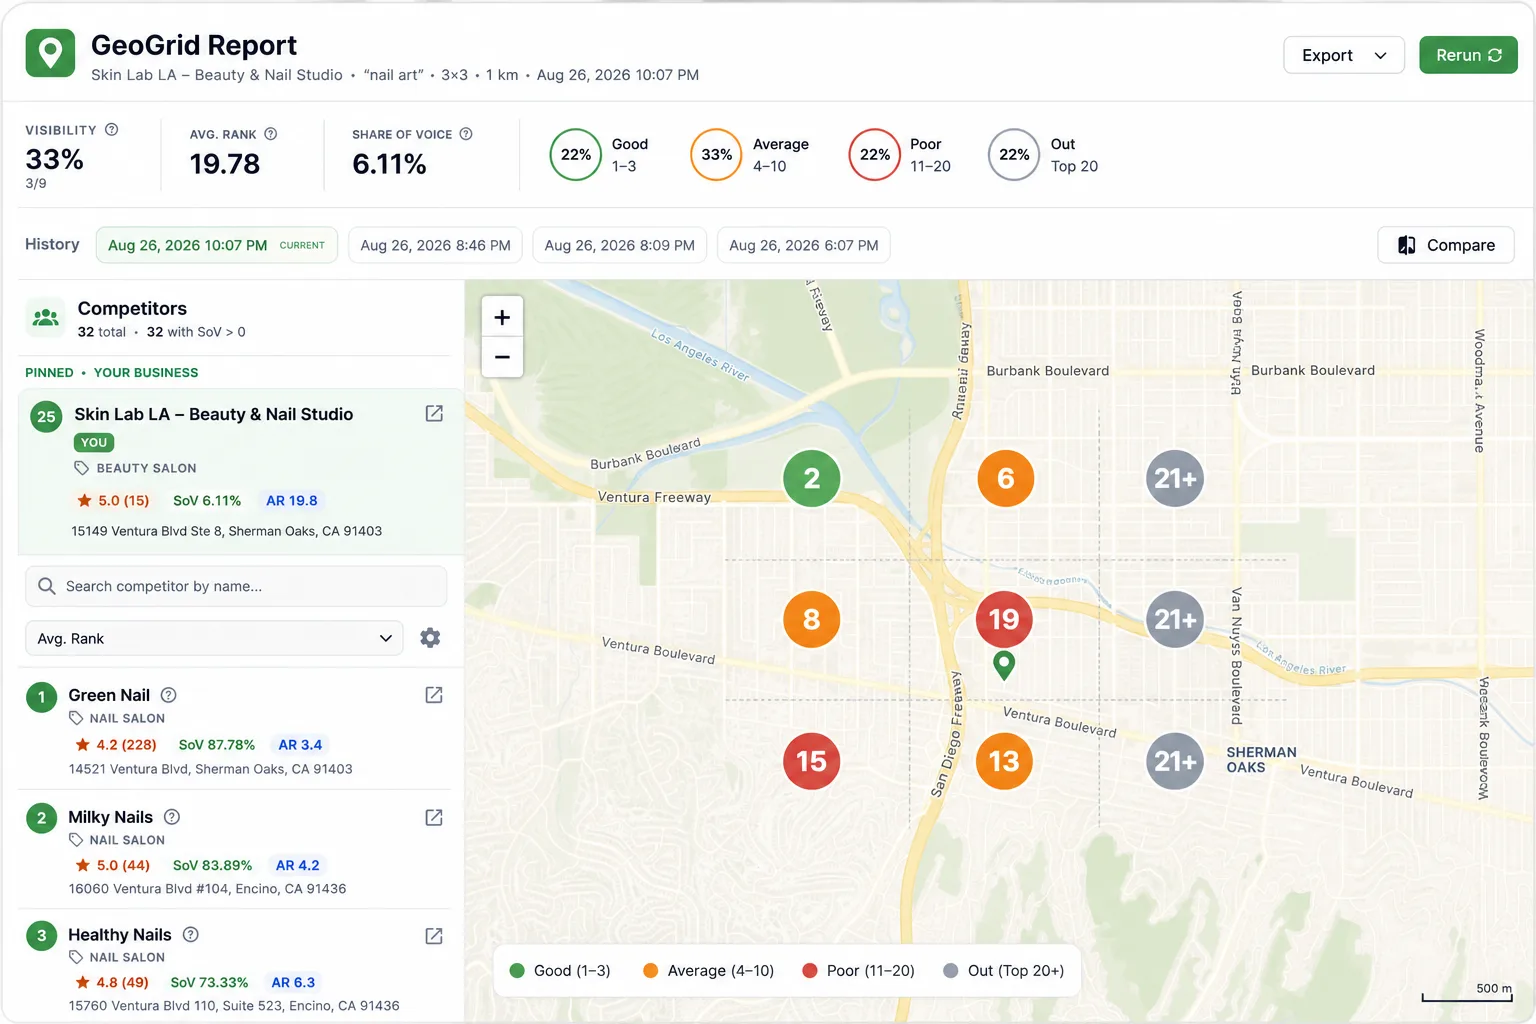
Spreadsheets do not show where rankings break down
Clients ask where they are strong and where they disappear. A heatmap with bucket percentages answers that faster than rows of rank numbers.
What you get
- Color-coded geo-grid map (Good 1–3, Average 4–10, Poor 11–20, Out 20+)
- Visibility, average rank (ARP), and Share of Voice metrics
- Rank distribution percentages across the grid
- Point-level Top 20 local pack detail for diagnosis
- Reports saved locally in your browser dashboard
Report highlights
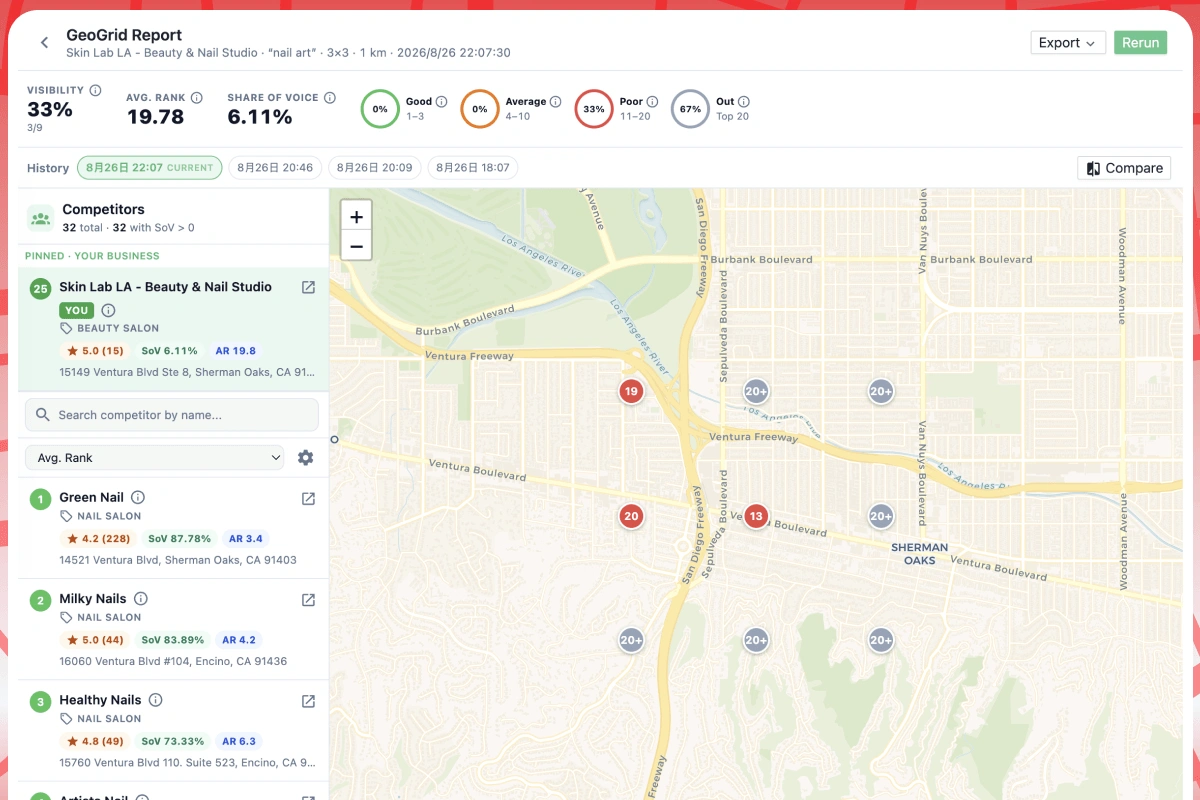
Geo-grid heatmap
See rank at every scan point on an interactive map.
Summary metrics
Visibility, ARP, and Share of Voice in one header.
Rank buckets
Good, Average, Poor, and Out percentages for quick health checks.
SERP drill-down
Click any pin to inspect the Top 20 businesses at that location.
Report preview
Use cases
Client reporting
Open the dashboard report during reviews instead of rebuilding slides.
Weak-zone targeting
Find red and grey pins where you fall out of the map pack.
Keyword comparison
Run separate scans per keyword and compare visibility patterns.
How to run Rank Report
Complete a geo-grid scan
Reports generate automatically when a scan finishes.
Open the report dashboard
Launch from the extension popup or the scan completion prompt.
Explore pins and metrics
Use the map, metric cards, and SERP panel to diagnose visibility.
Limits & Pro
- Free accounts can view up to 3 distinct reports per month.
- Re-opening a report you already viewed this month does not consume another slot.
- Pro unlocks unlimited views plus PDF, PNG, and CSV export.
Rank Report FAQ
What is Share of Voice?
Share of Voice summarizes how often your business appears and how highly it ranks across all grid points—higher is better.
Where are reports stored?
In your browser via the extension. They are not uploaded to ExtensionsFox servers for analysis.
Can I export the report?
PDF, map PNG, and CSV export are available on Pro.
Run Rank Report in your browser
Install Local Rank Tracker and run geo-grid scans on Google Maps—starting with Rank Report.